KPI
A project can have multiple KPIs. Each KPI represents a group of related rules, called an analysis type. Users of the free service will see two KPIs:
- General KPIs
- DAQS KPIs
General KPIs
This summarises all KPI scores on the dashboard. If there is only one other KPI, the results will be the same.
DAQS KPIs
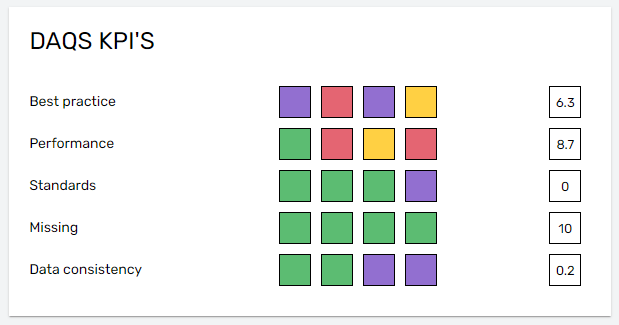
This shows the results of all the rules that are part of the DAQS analysis type. The colours are intended to draw your attention to areas where the rules have flagged issues that need attention.
Tip
Subscribers to the premium service can have more KPIs dedicated to specific requirements and their own rules, allowing you to tailor the analysis to the needs of the project.
Colours
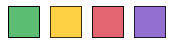
- Purple = More than 66.6% of the checked elements have an issue.
- Red = More than 33.3% and less than 66.6% of the checked elements have an issue.
- Yellow = More than 0% and less than 33.3% of the checked elements have an issue.
- Green = No issues found.
Model KPIs
Model KPIs show the results for a single analysed model. For example:
- Model A.rvt
Model A.rvt has 10 elements that have been analysed for 'rule 01' and 4 elements have issues. If this is the only rule, with these impact and priority settings, the KPI's colour will be red as 40% of the elements have issues.
Tip
On the model dashboard, click a colour swatch to view more information.
Project KPIs
Project KPIs show the results for all analysed models in the project. For example, consider a project with two models:
- Model A.rvt
- Model B.rvt
Model A.rvt has 10 elements that have been analysed for 'rule 01' and 4 elements have issues.
Model B.rvt has 20 elements that have been analysed for 'rule 01' and 2 elements have issues.
The impact of Rule 01 is set to 'Performance', and its priority is set to 'Critical'.
On the project dashboard, Rule 01 will show 30 checked elements and 6 issues.
If this is the only rule, with these impact and priority settings, the KPI's colour will be yellow as 20% of the elements have issues.
Tip
In a future version, you will be able to click a colour swatch on the project dashboard to view more information.
Rules
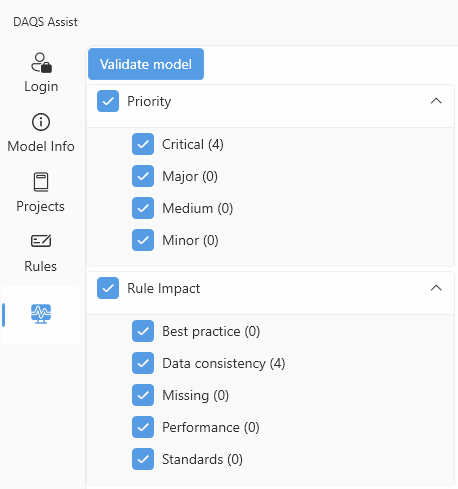
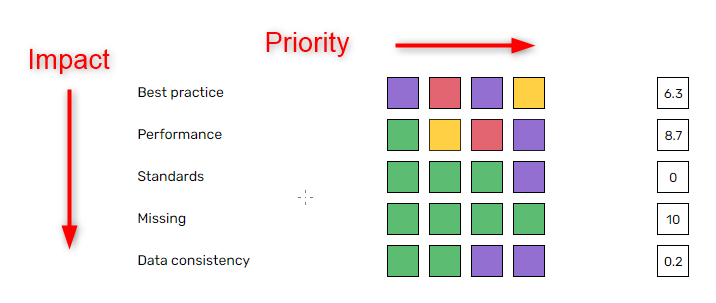
Each rule has an impact and a priority. These are shown in DAQS Assist and on the project and model dashboards.
Dashboard:
DAQS Assist: