Project
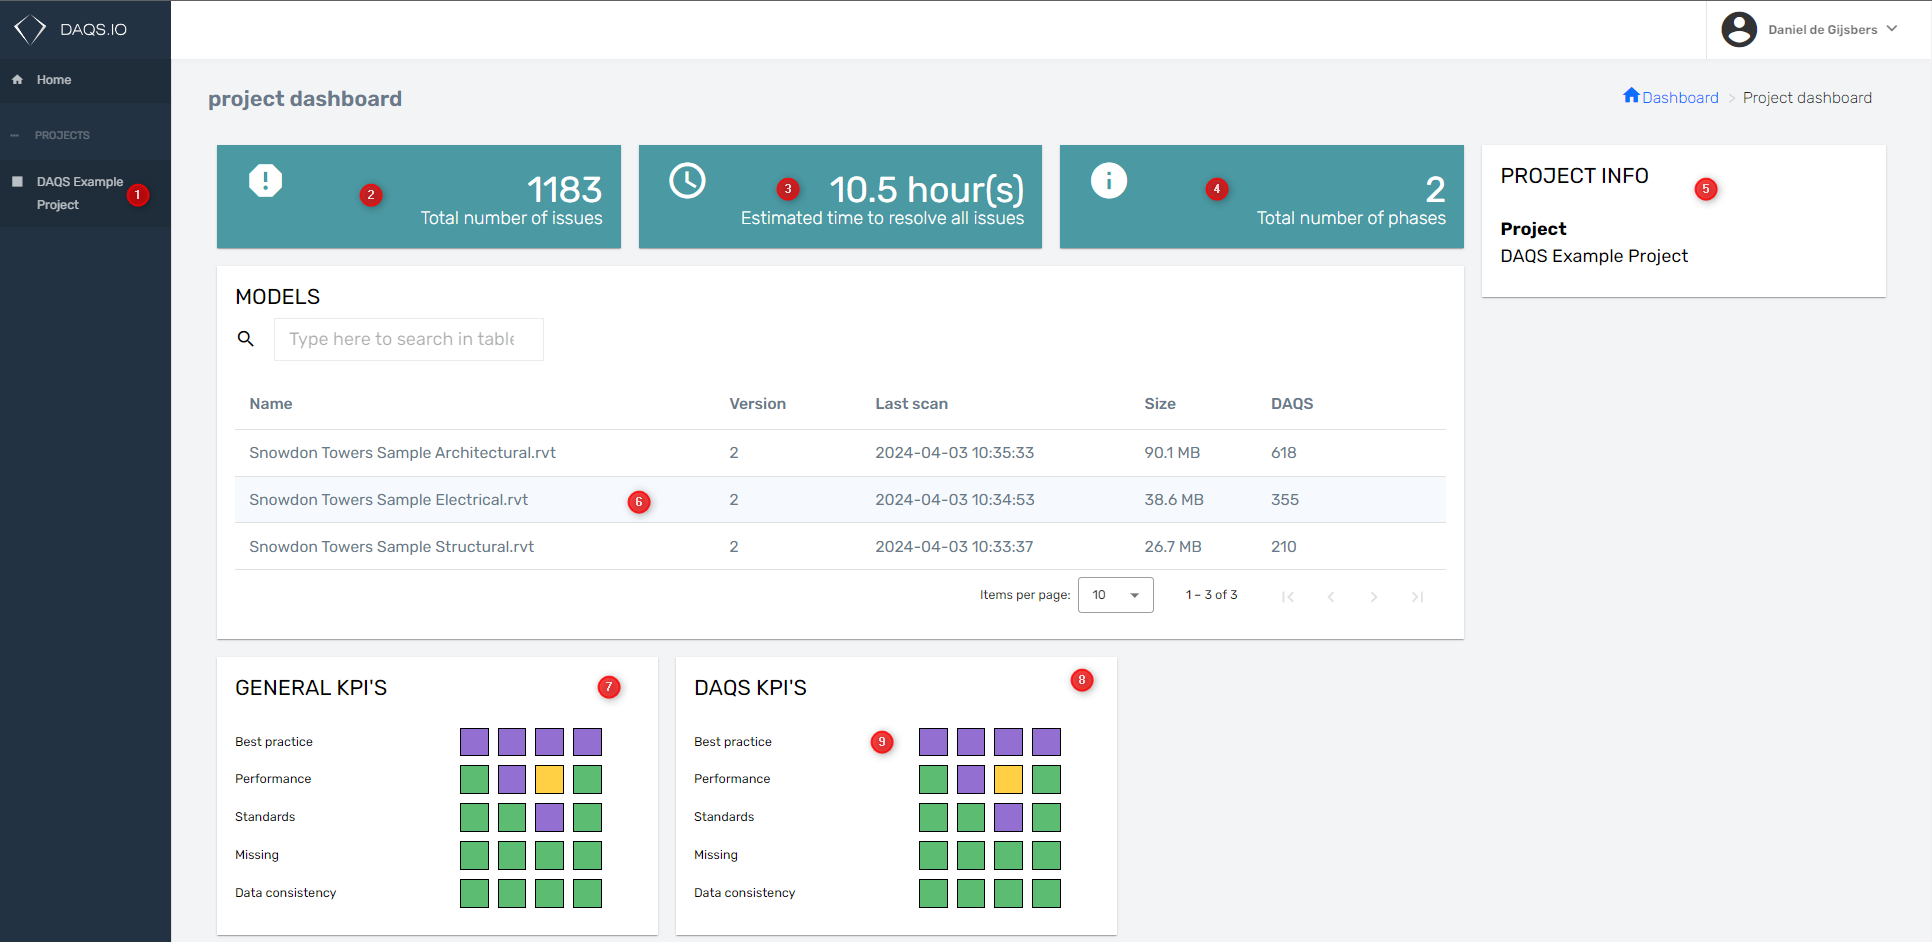
- List of the projects you have acces to.
- Configurable Widget to customize a dashboard.
- Every rule has a set time how long it would take to fix this error with native Revit functionality.
- Configurable Widget to customize a dashboard.
- Configurable Widget to customize a dashboard.
- A matrix of Revit project models, click on a model name to proceed to it's model dashboard.
- This is a KPI summary widget. This combines all the results of all other KPI widgets.
- DAQS KPI'S is a widget that by colour guides your attention to where it seems to be necessary.
- Purple = More than 66.6% of the found elements have an issue.
- Red = More than 33.3% and less than 66.6% of the found elements have an issue.
- Yellow = More than 0% and less than 33.3% of the found elements have an issue.
- Green = no issues found.